Aquaponics System
Mini Aquaponics Ecosystem
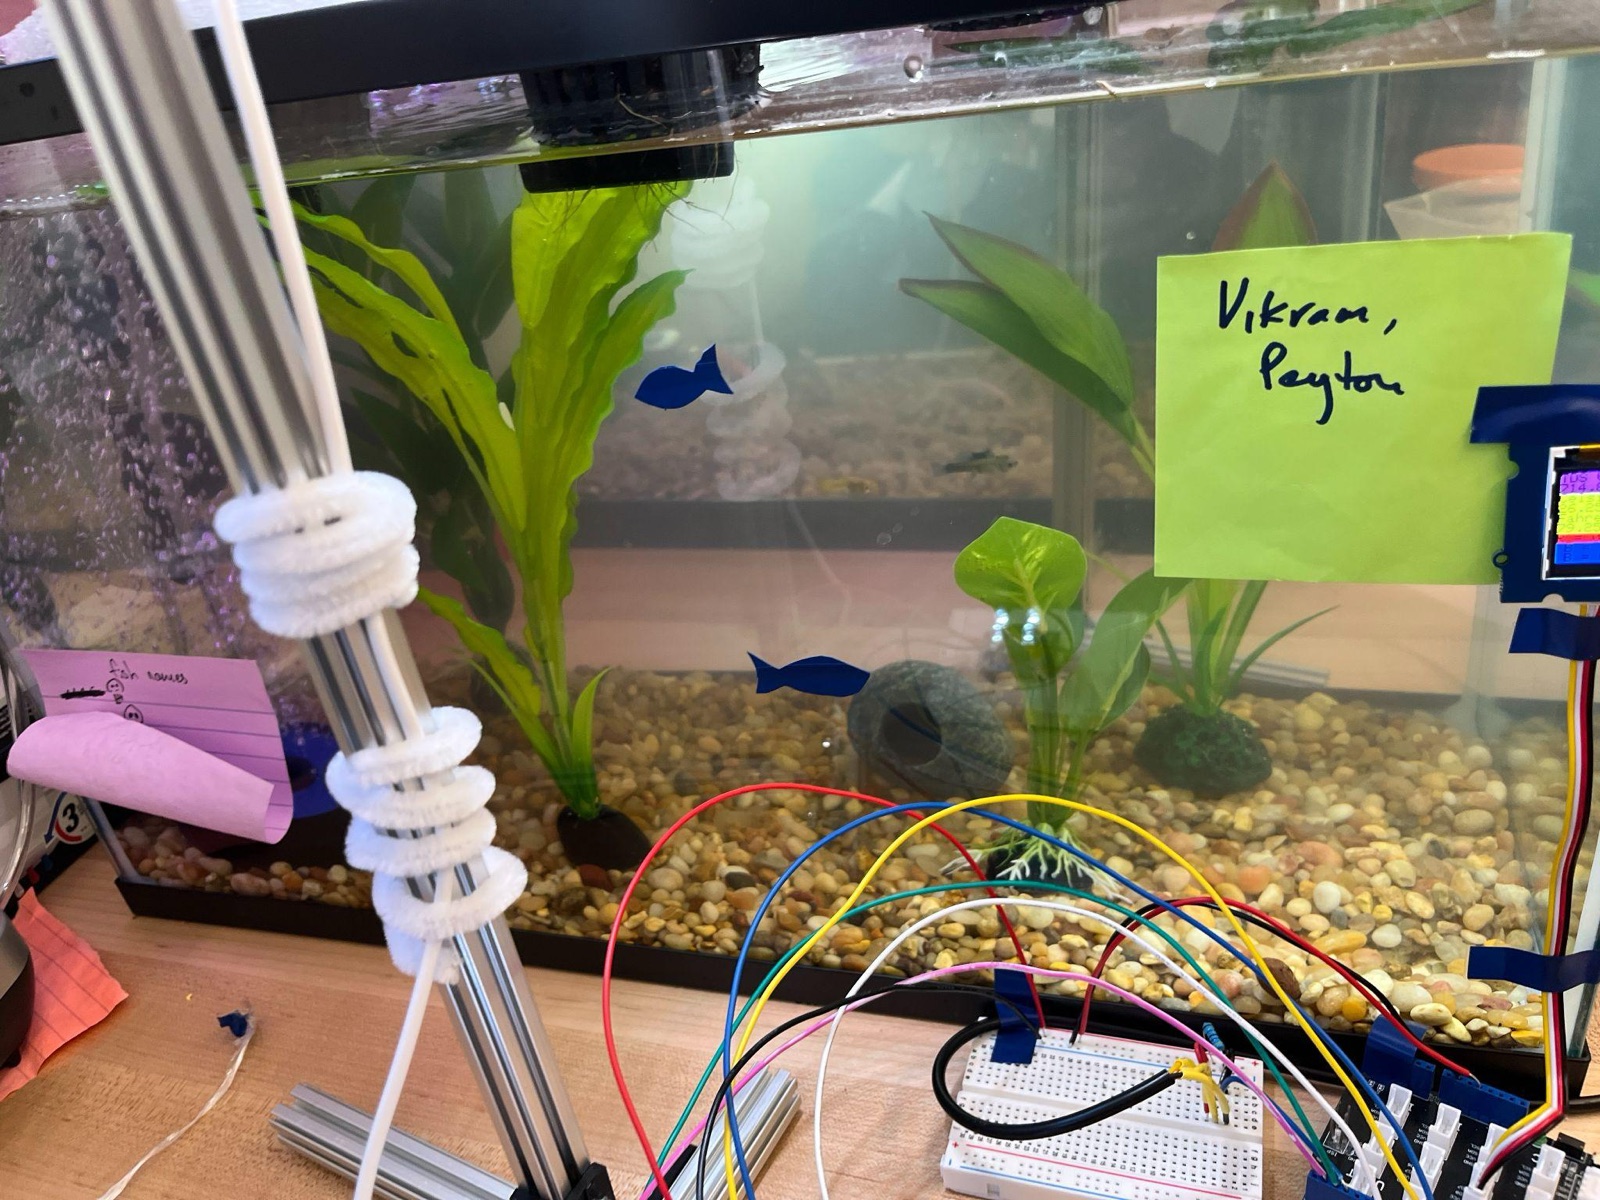
For our project we chose to do an aquaponics system. We set up a fish tank with guppies and floating strawberry plants on top of the water.
Research Question
Do plants lower nitrogen, ph, and dissolved solid levels in an aquaponics system?
pH
7 – 8
pH should be between 7 and 8.
Nitrate
< 40 ppm
Nitrate should be below 40 ppm
Nitrite
0.5 – 0 ppm
Nitrite should be 0.5-0 ppm.
Temperature
72 – 82
Temperature Between 72 and 82
Discover
Decision Matrix
Instructions: Rate each ecosystem on a 1 to 4 scale against the selection criteria, 4 being the highest.
| Selection Criteria | Earth Column | Aquaponics | Terrarium |
|---|---|---|---|
| Is semi-self-sustaining | 2 | 3 | 3 |
| Incorporates at least one biogeochemical cycle that can be measured by at least one Arduino sensor | 2 | 4 | 3 |
| Is possible to build, achieve homeostasis, and collect data within the project timeline | 1 | 2 | 3 |
| Can use the data collected to help maintain the system | 3 | 4 | 3 |
| Is safe and appropriately sized for installation on campus | 4 | 4 | 4 |
| Does not require excessive expenditure | 3 | 2 | 2 |
| Will excite and challenge us! | 2 | 3 | 2 |
| Total Score | 17 | 22 | 20 |
Ecosystem Choice
We think that it has a lot of opportunity for measurement of different bio-geochemical cycles. We also really like the fact that there is water within the system which will provide more challenge.
Ideate
System Diagram
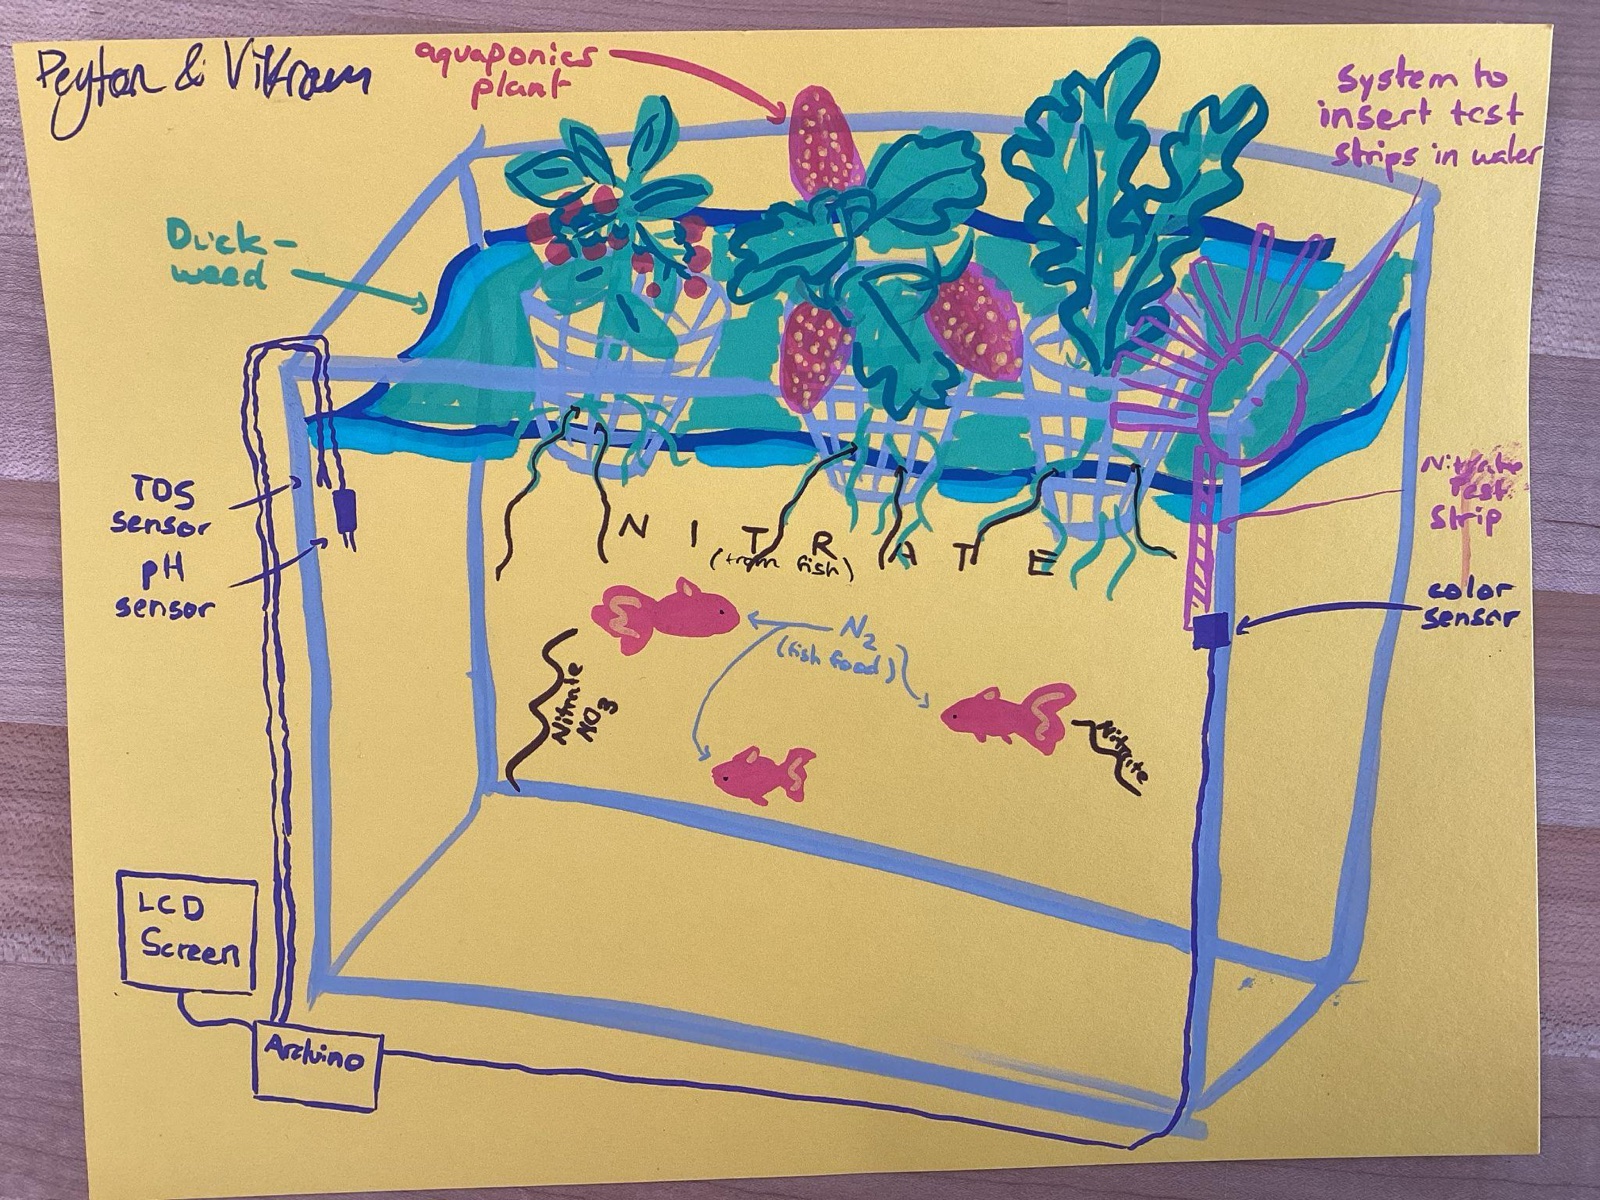
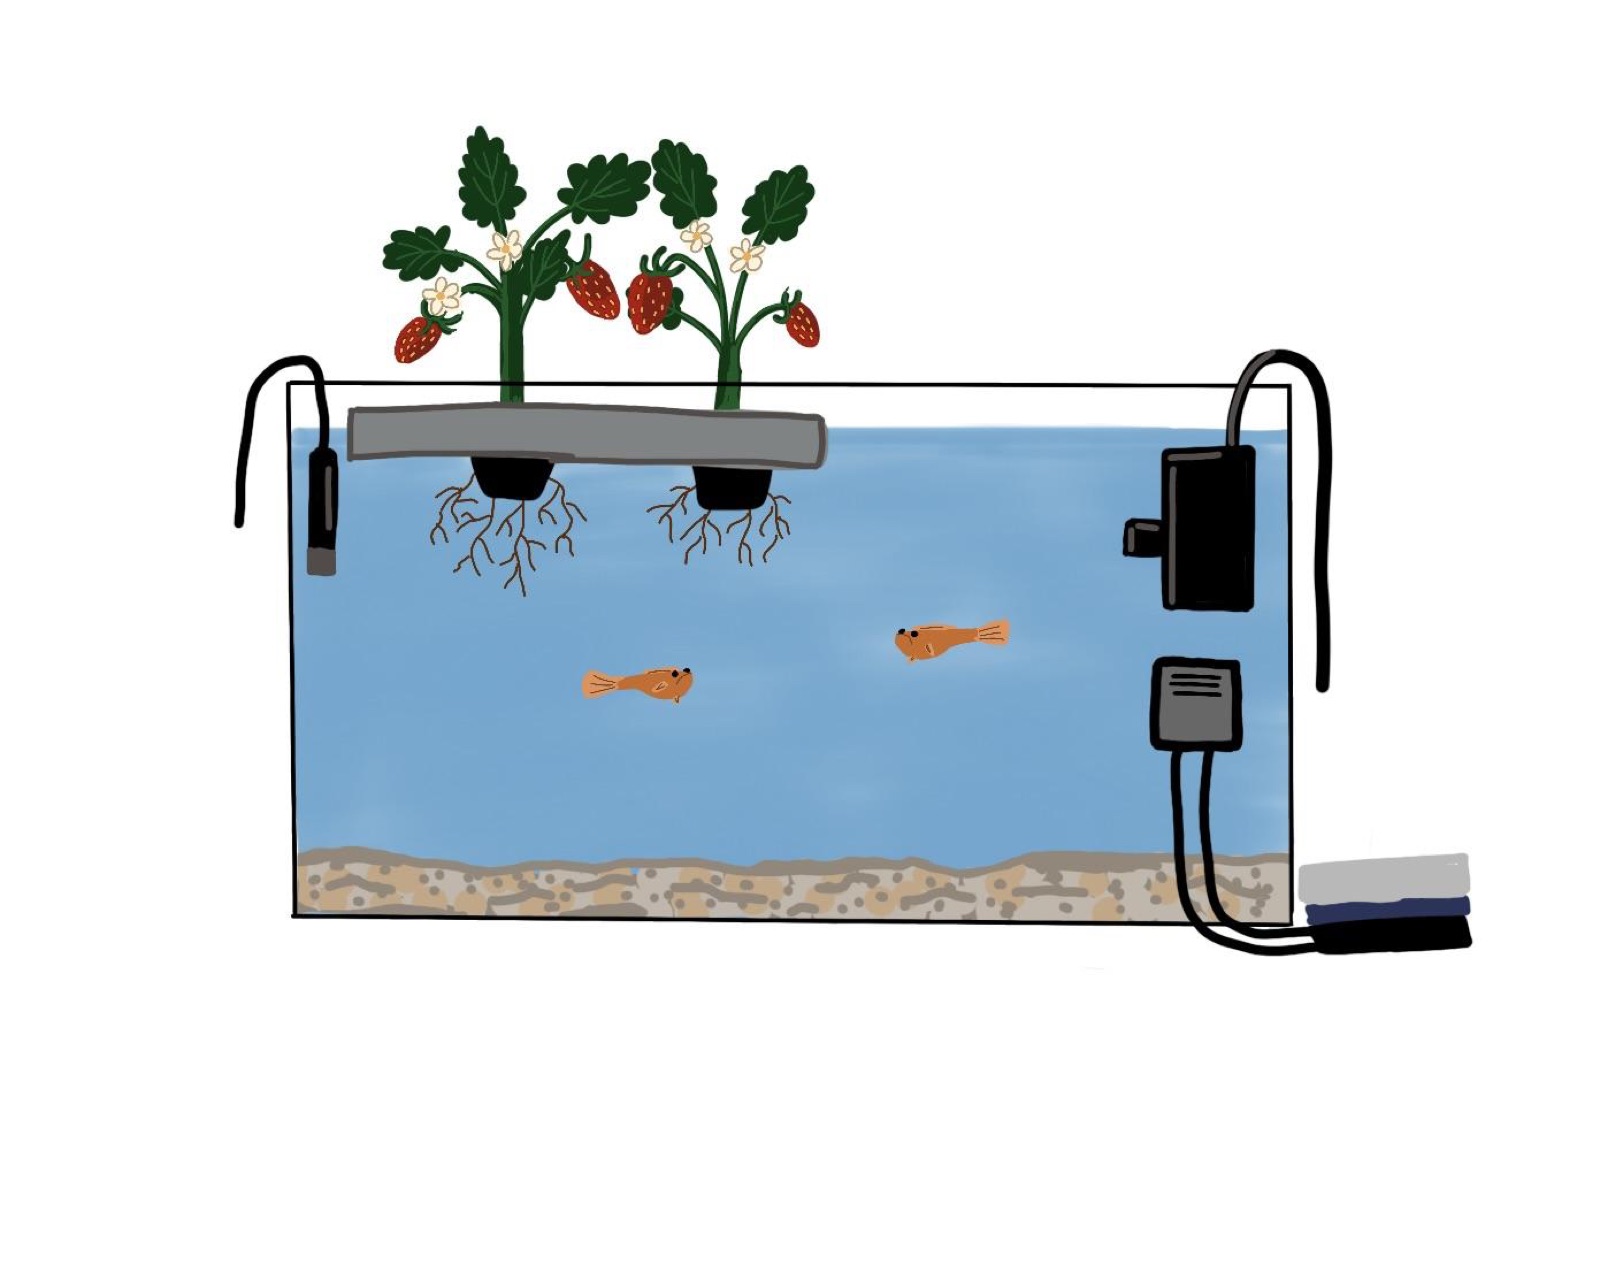
Explanation
(We didn’t want to write it on our beautiful drawing =))
- Fish eat their food (algae in the water, and fish food)
- They turn nitrogen in the food to Nitrate.
- Their byproducts also increase the acidity in the water.
- Once these solids dissolve, they will increase the number of dissolved solids in the water.
- Plants moderate nitrate (by absorbing the nitrate)
- Plants moderate acidity (by absorbing the nutrients that cause it)
- Plants moderate dissolved solids levels by absorbing it.
We have a pH and Nitrate test strip to monitor pH and Nitrate. The arduino also has a temperature sensor and a Total Dissolved Solids (TDS) Sensor.
Prototype
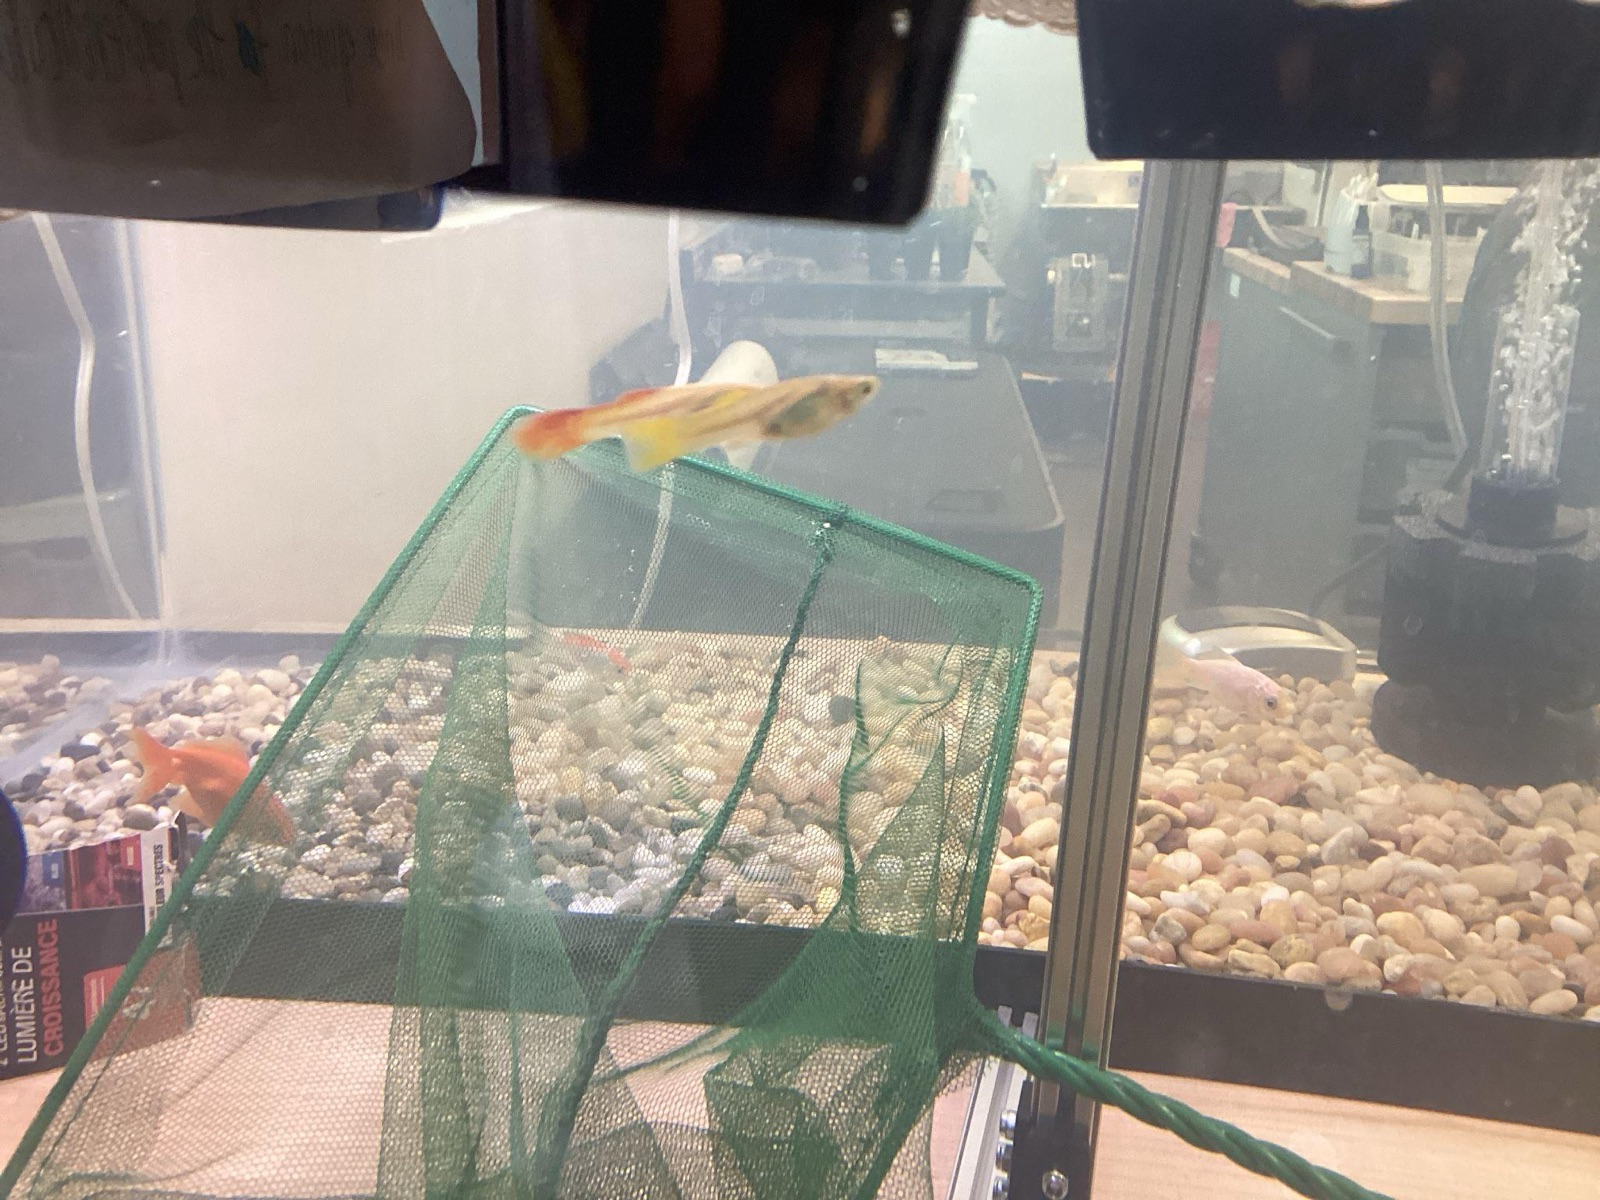
Ecosystem Build
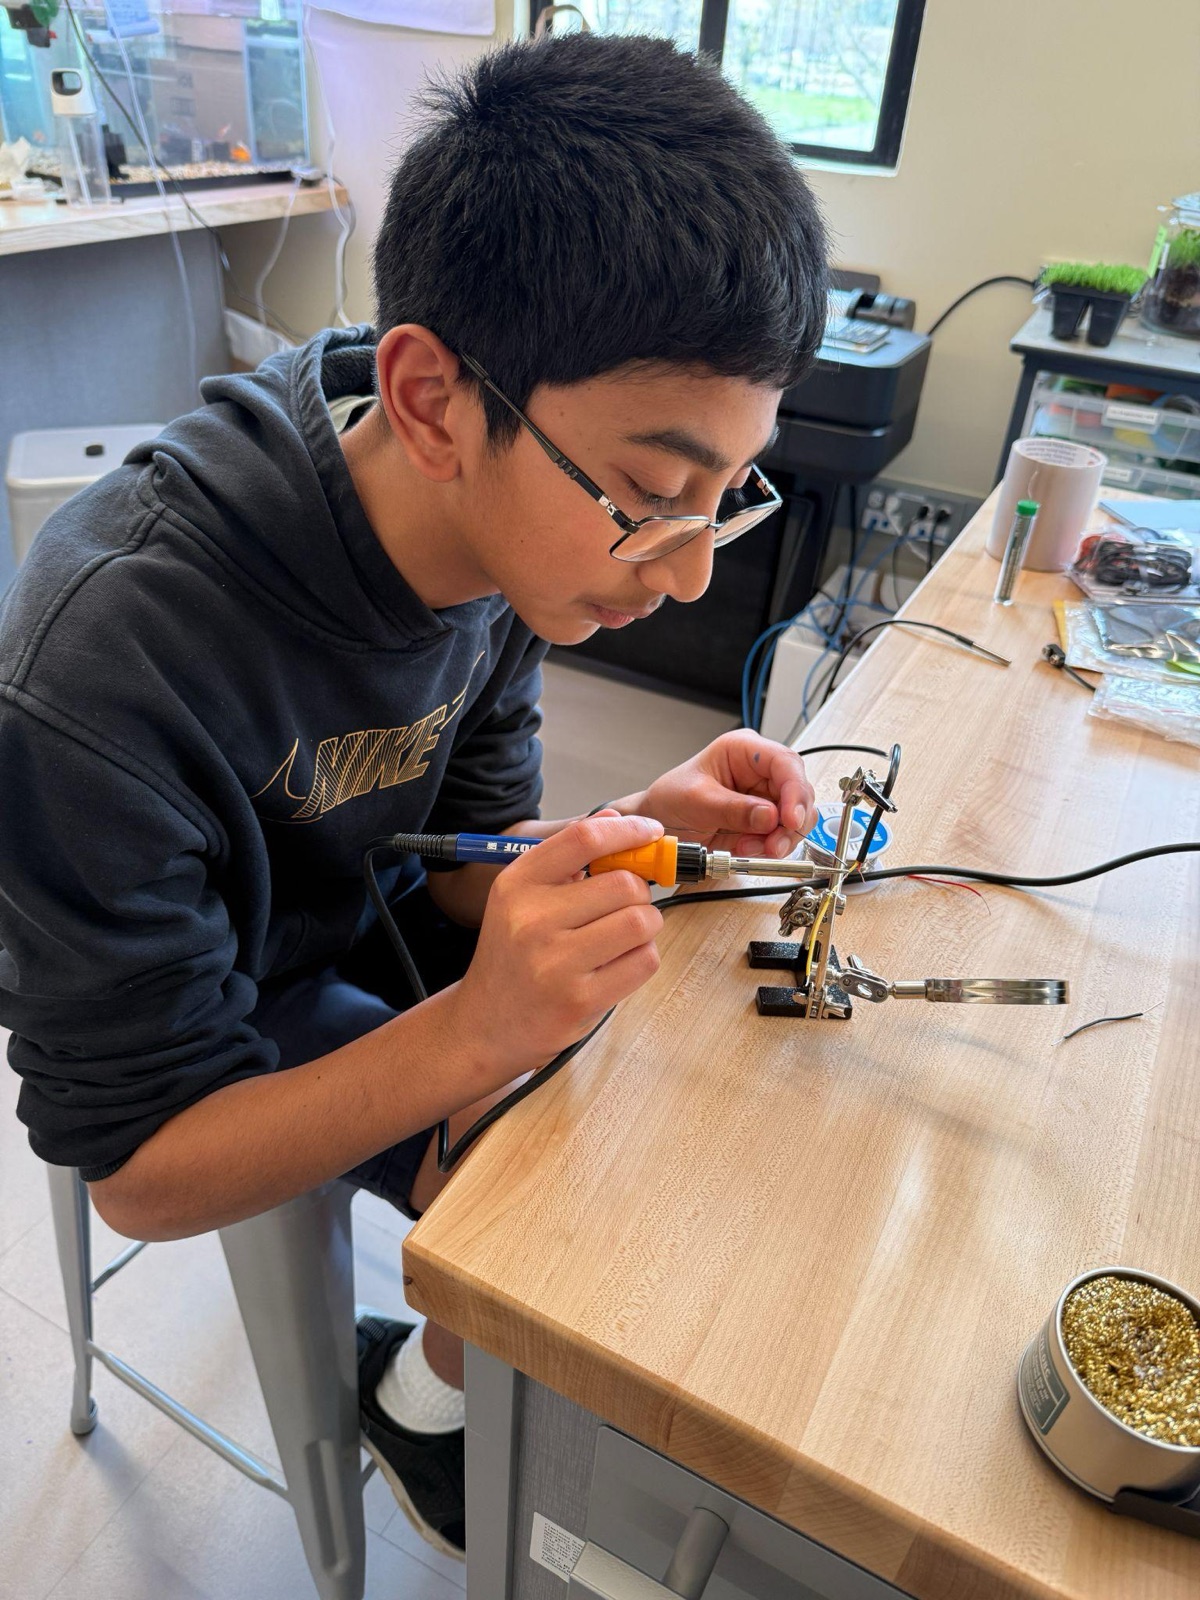
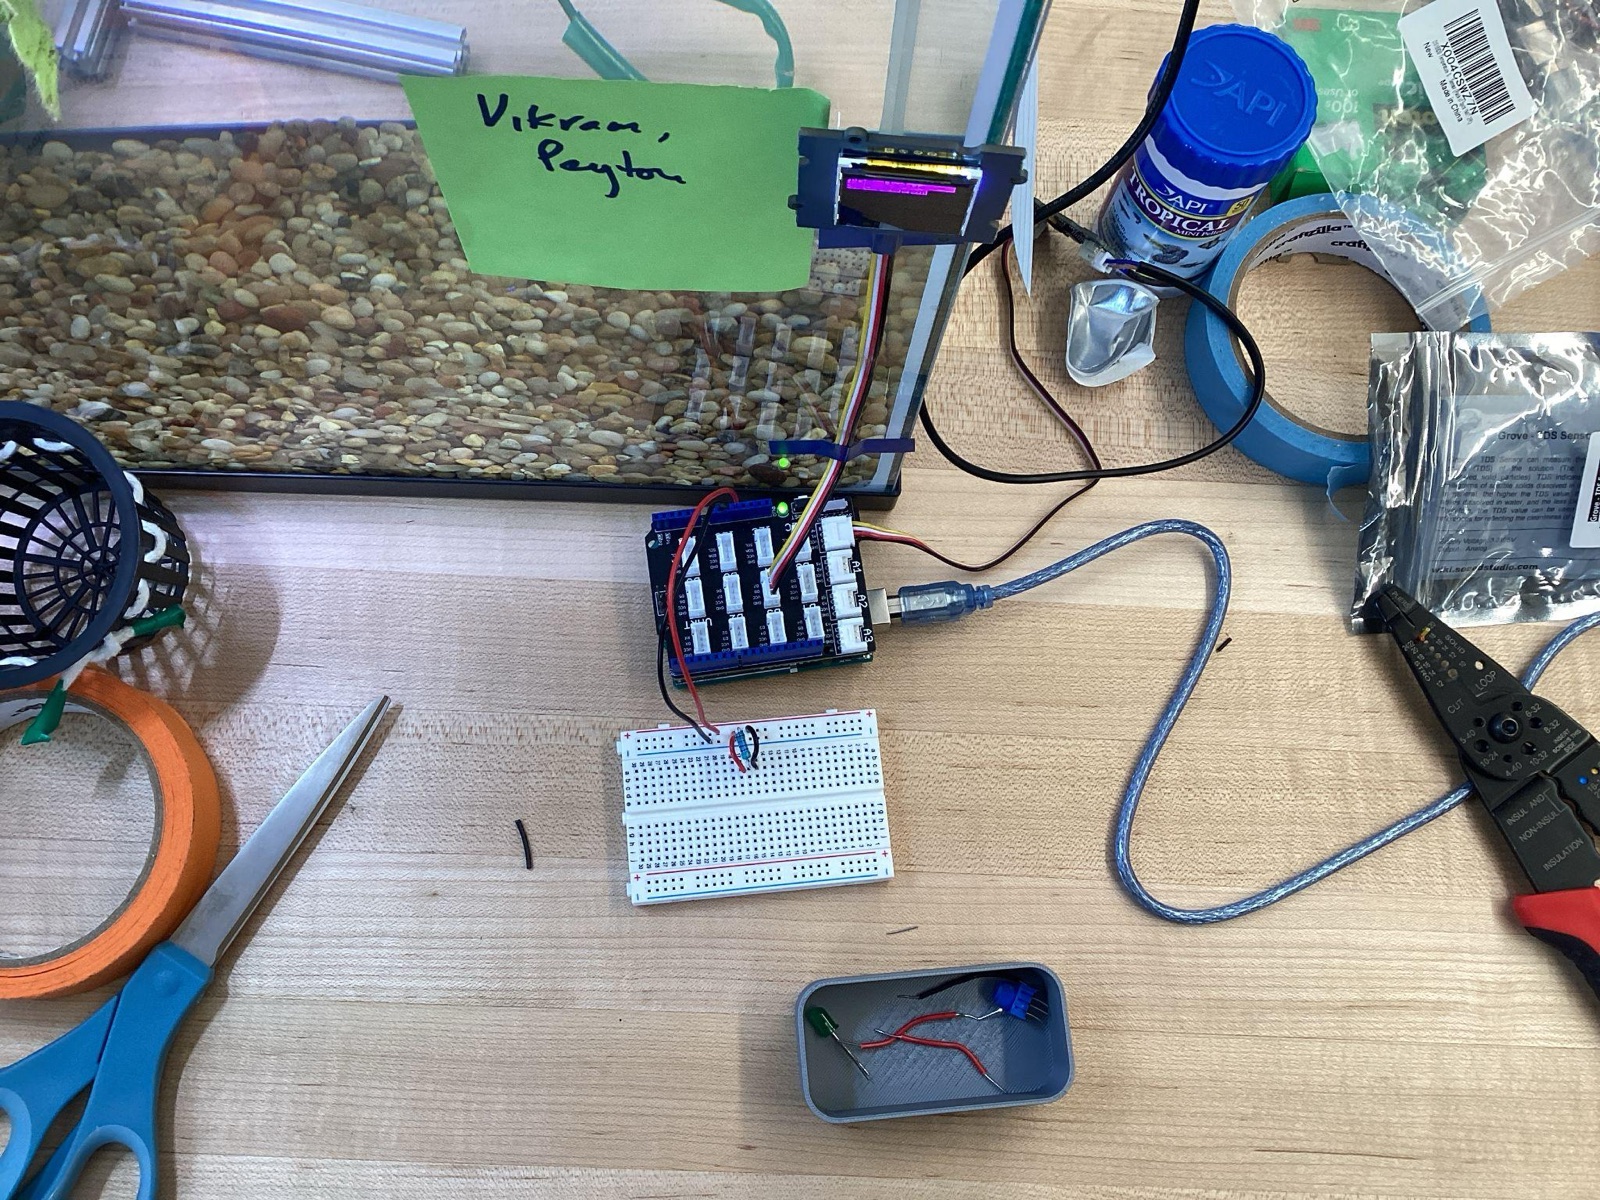
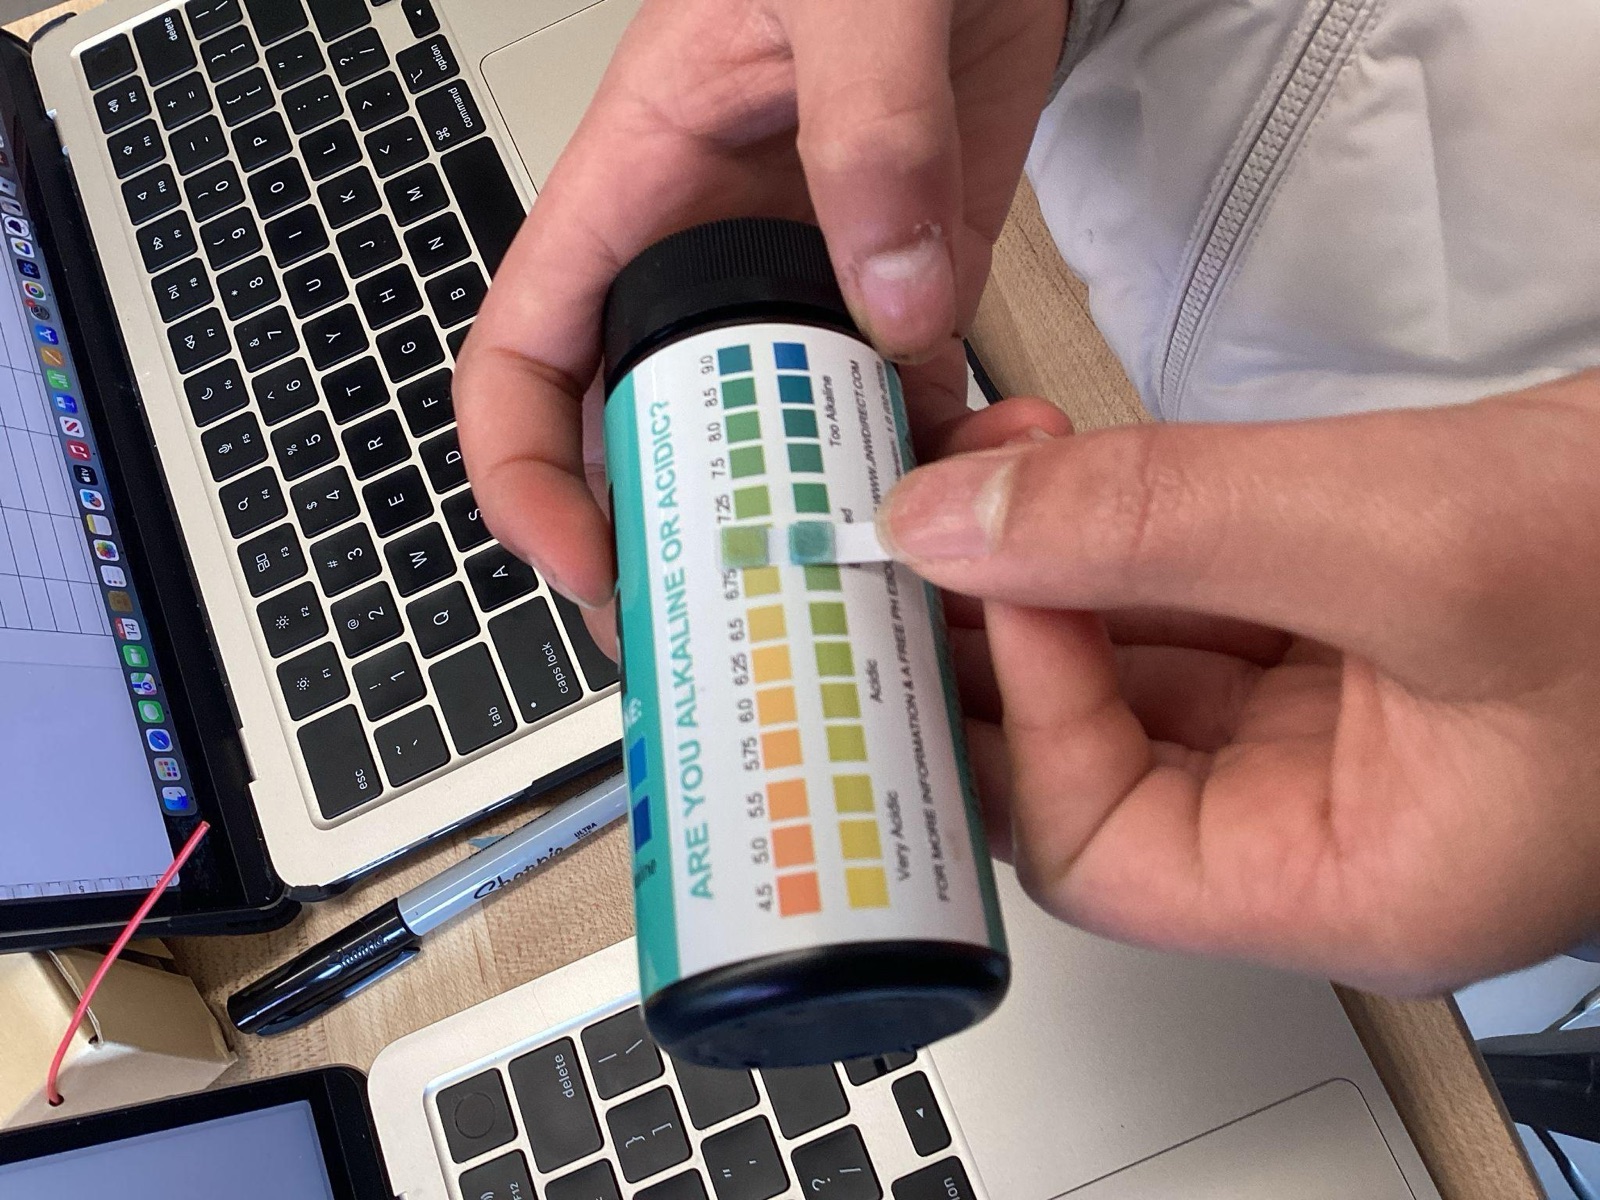
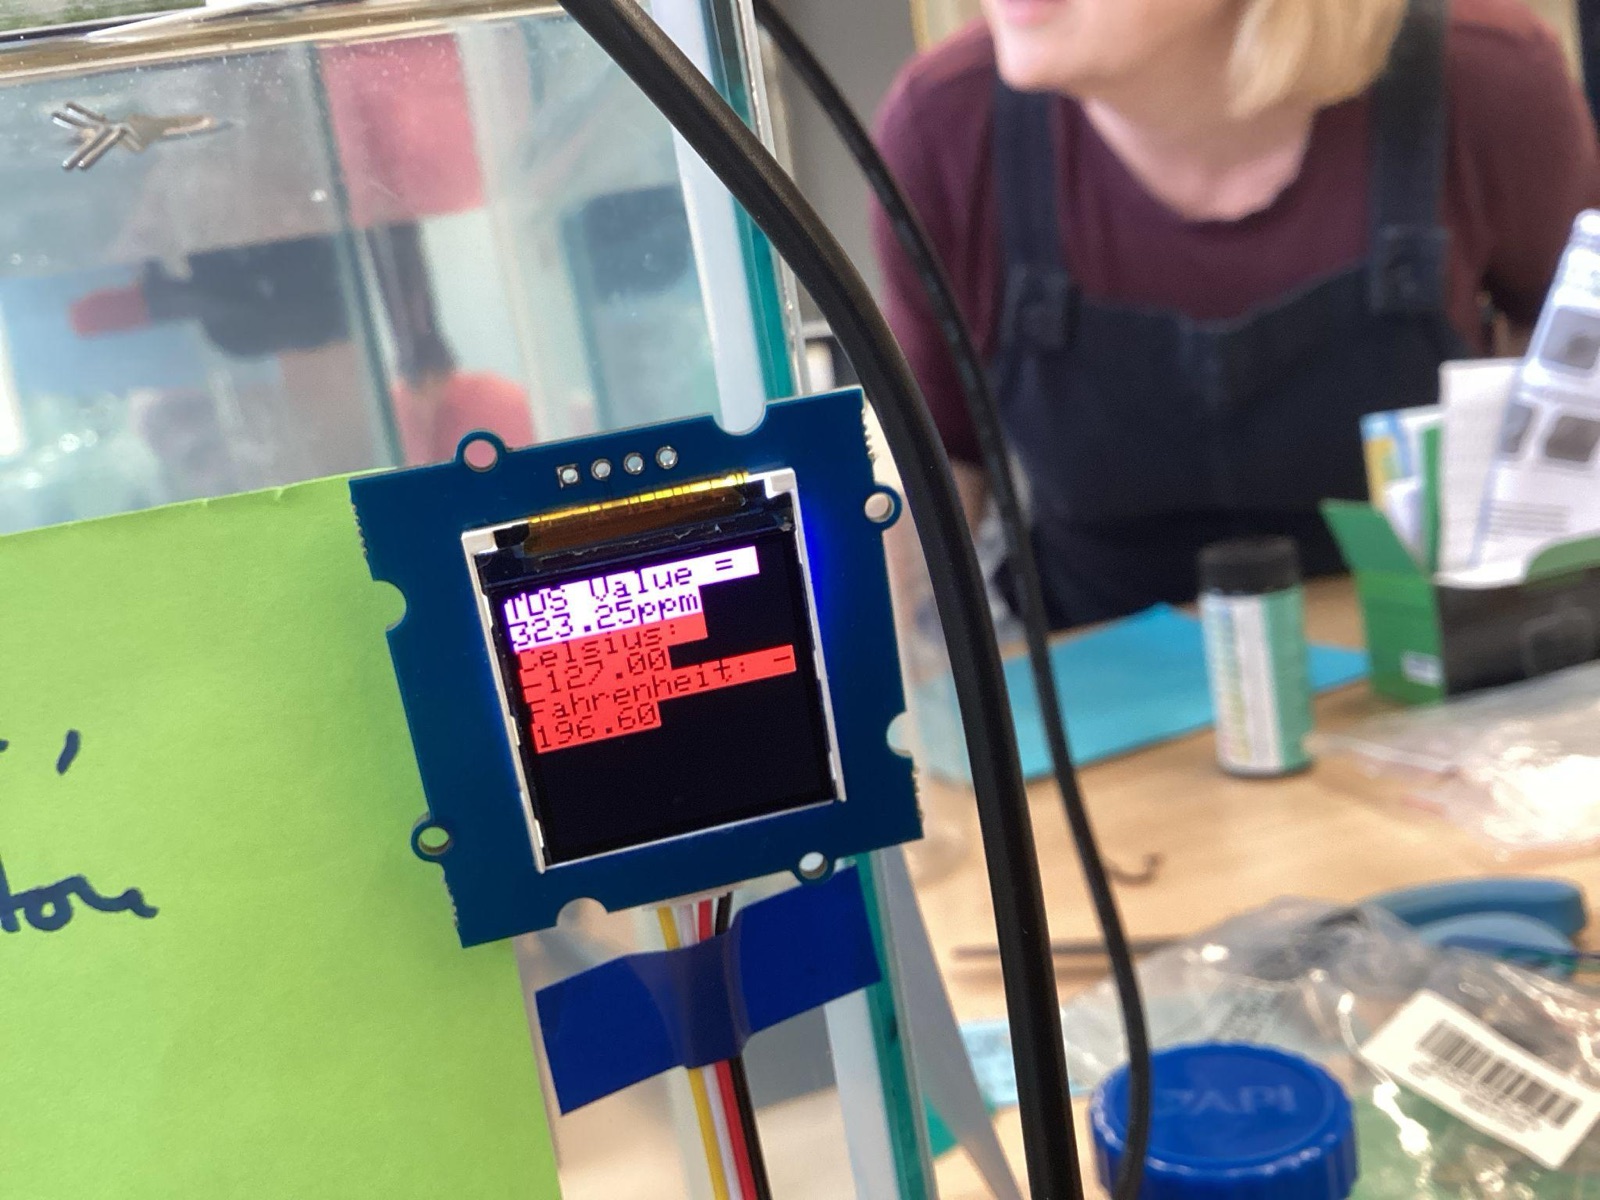
Sensors
Sensors and code
We used two arduino sensors: a temperature sensor, and a total dissolved solids (TDS) sensor. We were originally planning on including a color sensor to test the color of the test strips, but, becuase the color sensor was too sensitive, we did not use it.
void loop() {
  lcd.setCursor(0, 0);
  lcd.setTextSize(3);
  sensorValue = analogRead(sensorPin);
  Voltage = sensorValue*5/1024.0; //Convert analog reading to Voltage
  tdsValue=(133.42*Voltage*Voltage*Voltage - 255.86*Voltage*Voltage + 857.39*Voltage)*0.5; //Convert voltage value to TDS value
  SERIAL.print("TDS Value = ");
  SERIAL.print(tdsValue);
  SERIAL.println(" ppm");
  lcd.setTextColor(BLACK, MAGENTA);
  lcd.println("TDS Value = ");
  lcd.print(tdsValue);
  lcd.println("ppm");

  // Call sensors.requestTemperatures() to issue a global temperature and Requests to all devices on the bus
  sensors.requestTemperatures();
  Serial.println(sensors.requestTemperatures());
  lcd.setTextColor(BLACK, YELLOW);
  lcd.println("Celsius: ");
  // Why "byIndex"? You can have more than one IC on the same bus. 0 refers to the first IC on the wire
  lcd.println(sensors.getTempCByIndex(0));
  lcd.println("Fahrenheit: ");
  lcd.println(sensors.getTempFByIndex(0));
  Serial.println("Celsius: ");
  // Why "byIndex"? You can have more than one IC on the same bus. 0 refers to the first IC on the wire
  Serial.println(sensors.getTempCByIndex(0));
  Serial.println("Fahrenheit: ");
  Serial.println(sensors.getTempFByIndex(0));
  delay(1000);

  // Setting RED (R) filtered photodiodes to be read
  digitalWrite(S2,LOW);
  digitalWrite(S3,LOW);
  // Reading the output frequency
  redFrequency = pulseIn(sensorOut, LOW);
  // Printing the RED (R) value
  lcd.setTextColor(BLACK, RED);
  Serial.print("R = ");
  lcd.print("R = ");
  Serial.print(redFrequency);
  lcd.print(redFrequency);
  delay(100);

  // Setting GREEN (G) filtered photodiodes to be read
  digitalWrite(S2,HIGH);
  digitalWrite(S3,HIGH);
  // Reading the output frequency
  greenFrequency = pulseIn(sensorOut, LOW);
  // Printing the GREEN (G) value
  lcd.setTextColor(BLACK, GREEN);
  Serial.print(" G = ");
  lcd.print("G = ");
  Serial.print(greenFrequency);
  lcd.println(greenFrequency);
  delay(100);

  // Setting BLUE (B) filtered photodiodes to be read
  digitalWrite(S2,LOW);
  digitalWrite(S3,HIGH);
  // Reading the output frequency
  blueFrequency = pulseIn(sensorOut, LOW);
  // Printing the BLUE (B) value
  lcd.setTextColor(BLACK, BLUE);
  Serial.print(" B = ");
  lcd.print(" B = ");
  Serial.print(blueFrequency);
  lcd.print(blueFrequency);
  delay(100);
}
Evaluate
Results
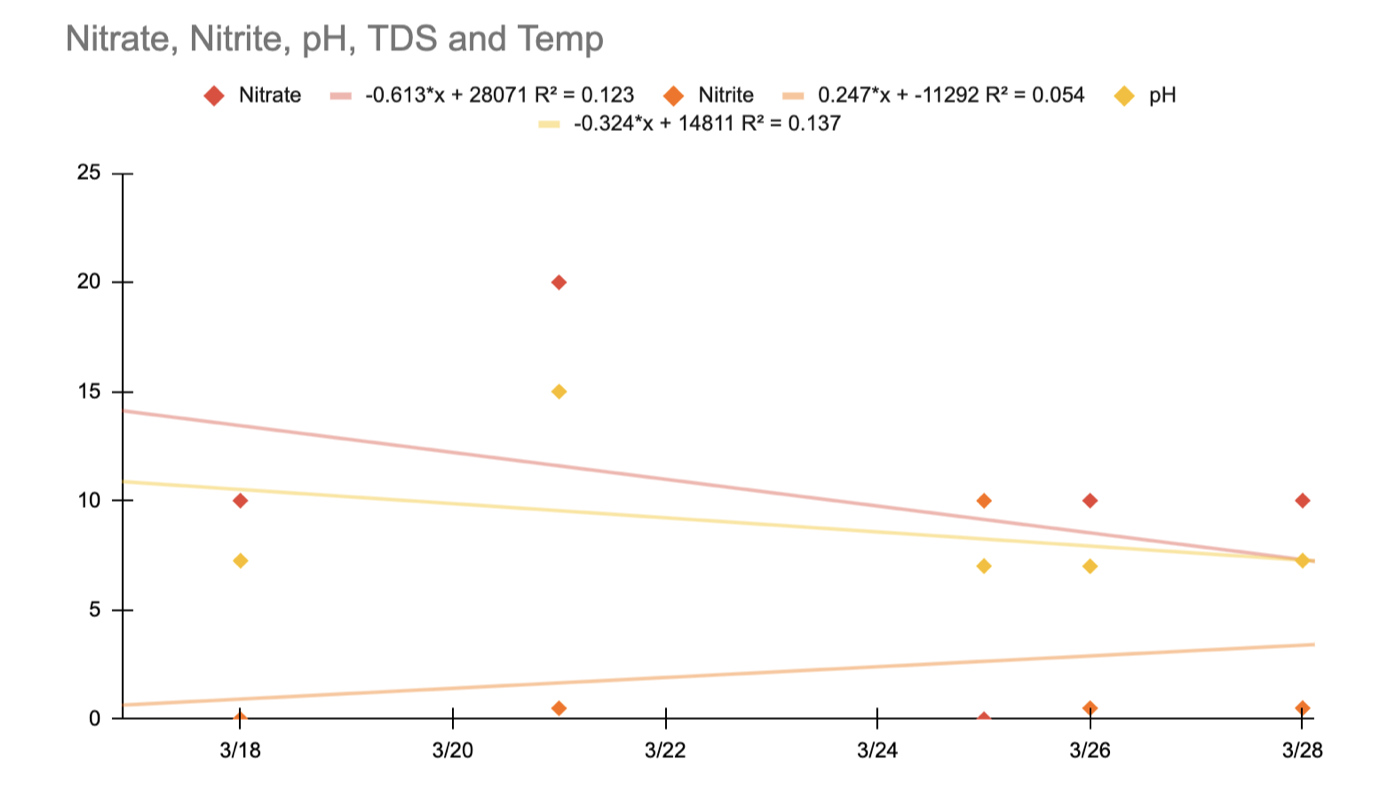
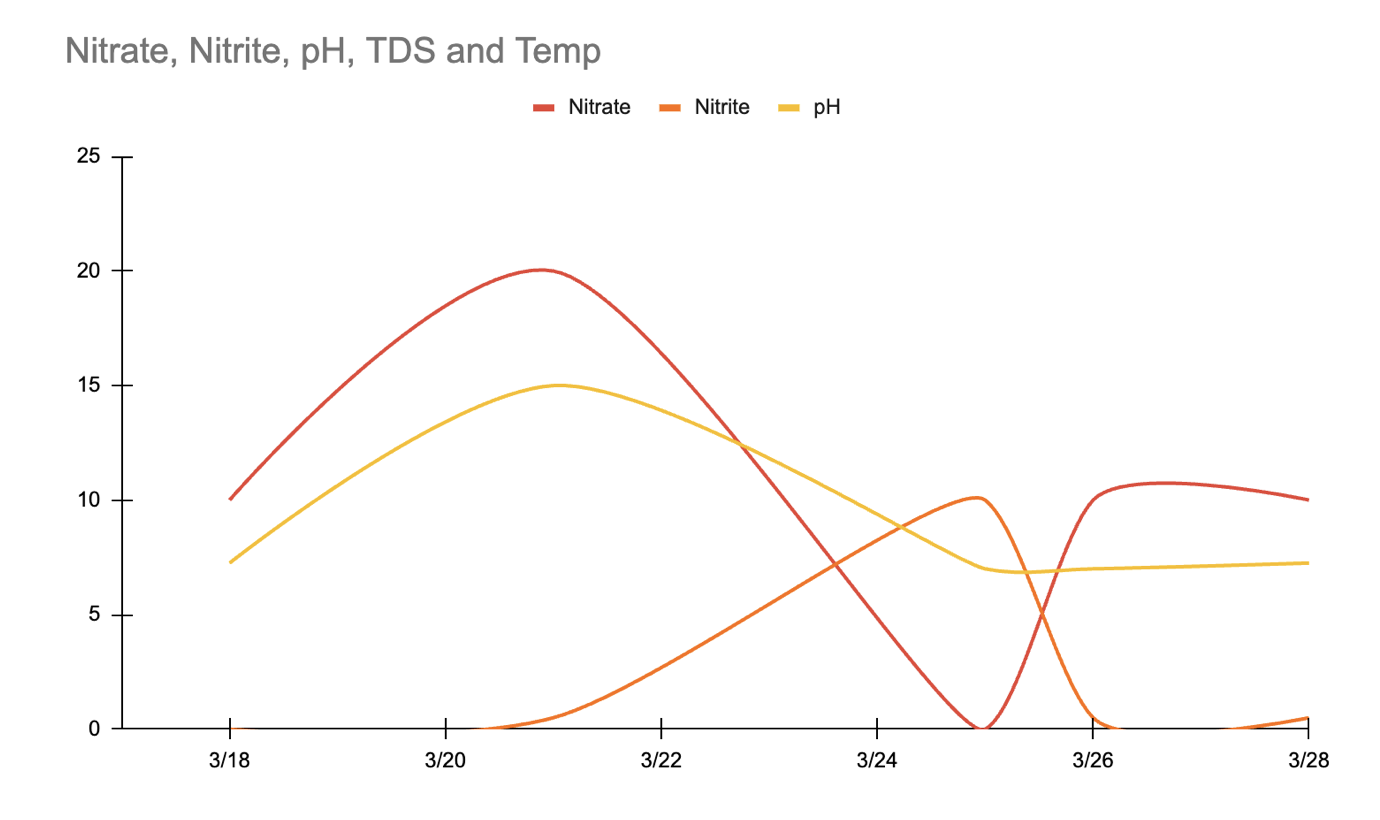
As you can see, the level of TDS, pH, Nitrate, and Nitrite stayed consistent throughout the entire experiment. These levels stayed consistent throughout the growth of the plants, and the feeding and defecation of the fish. This clearly shows how the plants moderate the levels of byproducts from the fish.
Data
| Date | Time | Data Collected | Value | Notes |
|---|---|---|---|---|
| 3/14 | 2:15 | pH | 7.25 | |
| 3/14 | 2:15 | Nitrate | 10 | |
| 3/14 | 2:15 | Nitrite | 0 | |
| 3/14 | 2:15 | TDS | 88.73 | |
| 3/17 | 1:45 | pH | 7.5 | |
| 3/17 | 1:45 | Nitrate | 10 | |
| 3/17 | 1:45 | Nitrite | 0 | |
| 3/17 | 1:50 | Temp | 79° F | |
| 3/18 | 5:30 | pH | 7.0 | |
| 3/18 | 5:30 | Nitrate | 0 | Plants starting to grow roots out of the mesh. |
| 3/18 | 5:30 | Nitrite | 10 | |
| 3/18 | 5:30 | Temp | 77.45 | |
| 3/21 | 2:20 | pH | 7.0 | |
| 3/21 | 2:20 | Nitrate | 10 | Plants starting to grow roots out of the mesh. |
| 3/21 | 2:20 | Nitrite | 0.5 | |
| 3/21 | 2:20 | Temp | 80.37 | |
| 3/21 | 2:20 | TDS | 846.31 | |
| 3/25 | 2:20 | pH | 7.25 | |
| 3/25 | 2:20 | Nitrate | 10 | |
| 3/25 | 2:20 | Nitrite | 0.5 | |
| 3/25 | 2:20 | Temp | 76.55 | |
| 3/25 | 2:20 | TDS | 441 | Added in a new aerator. |
| 3/26 | 10:00 | pH | 7.5 | |
| 3/26 | 10:00 | Nitrate | 10 | |
| 3/26 | 10:00 | Nitrite | 0.5 | |
| 3/26 | 10:00 | Temp | 79.14 | |
| 3/26 | 10:00 | TDS | 454.02 | |
| 3/28 | 8:28 | pH | 7.5 | |
| 3/28 | 8:28 | Nitrate | 0.5 | |
| 3/28 | 8:28 | Nitrite | 10 | |
| 3/28 | 8:28 | Temp | 79.59 | |
| 3/28 | 8:28 | TDS | 480.83 | |
| 3/17 | 11:10 | pH | 7.5 | |
| 3/17 | 11:10 | Nitrate | 10 | |
| 3/17 | 11:10 | Nitrite | 0.5 | |
| 3/17 | 11:10 | Temp | 79.7° F | |
| 3/17 | 11:10 | TDS | 445.97 |
Conclusion
We have homeostasis!
Figure 1 shows the balance of the Nitrogen while Figure 2 shows the fluctuation. We have nitrogen homeostasis in this system.